Photocatalytic water splitting by Photosystem II
In cyanobacteria, algae, and plants water oxidation achieved by Photosystem II (PSII) constitutes a fundamental biochemical process empowering life on Earth, and setting the paradigm for engineering solar fuel–production systems. The Oxygen Evolving Complex (OEC) of PSII is an inorganic oxygen-bridged Mn4CaO5 cluster which utilizes solar energy to split two water molecules into molecular oxygen and protons (eq.1), and produces reducing equivalents that are subsequently employed in carbon fixation reactions.
2H2O→O2+4H++4e- (1)
This is a four-step photochemical process that is coupled to charge separation. The OEC catalyzes the oxidation of water by the sequential absorption of four photons. Upon each photon excitation, an electron is transferred from P680, a special chlorophyll dimer, to the acceptor side that consists of a pheophytin molecule and of a terminal iron-quinone complex (QAFe2+QB). The OEC acts as the electron donor to P680•+ via a redox-active Tyrosine (TyrZ, Yz, Y161), Thus, the OEC cycles through five oxidation states, S0-S1,…S4-S0, known as S-state transitions of Kok cycle. The O2 release takes place during the S3-[S4]-S0 transition, S4 being a transient, while the release of protons occurs through the entire Kok cycle with a pattern of 1:0:1:2 for the S0→S1, S1→S2, S2→S3, S3→S0, respectively (Figure 1).
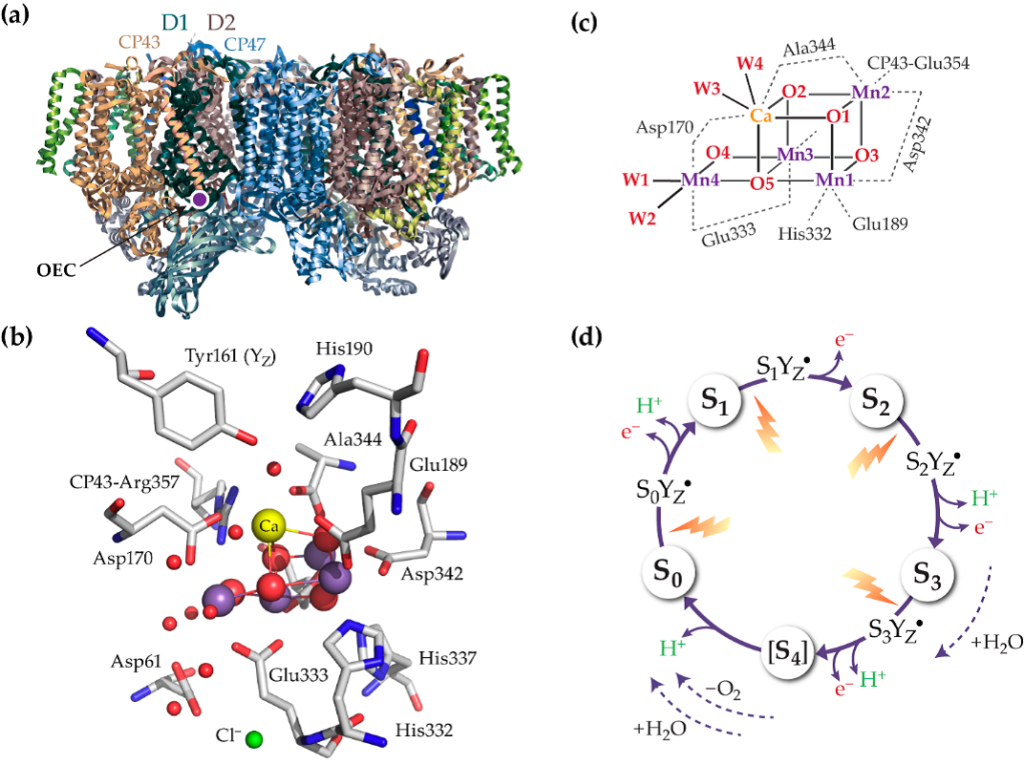
The gradual proton and electron transfers create various configurations of the OEC, which are either electrically neutral (Sin) or positively charged (Si+). Particularly, the S0, S1, S2, and S3 states are alternatively indicative as S0n, S1n, S2+, and S3+, respectively. Additional intermediates of the S-state transitions, known as metalloradical intermediate states (SiTyrZ•), involve the aminoacid radical of TyrosineZ (figure 2), believed to play a critical role in the proton and electron transfer reactions during the water oxidation process.
An unusual photochemical phenomenon occurs when the OEC reaches the highest oxidation states prior to oxygen evolution. Manganese becomes photo-chemically active, converting to a powerful oxidant, upon excitation by light in the near IR region. This effect is detected at cryogenic temperatures, where the chlorophyll-based charge separation is inhibited, and the lifetime of chemical intermediates becomes long enough, and can be summarized in the following equation:
[Mn4CaΟ5]n + Tyr Z + hν→ [Mn4CaΟ5]n-1 + Tyr Z• + Η+ (2)
The paramagnetic nature of the related critical elements, such as Mn4CaO5 and the Yz• radical, make the PSII an ideal system that can be studied with magnetic methods and in particular with Electron Paramagnetic Resonance spectroscopy (EPR). Moreover, the aforementioned charge transfers taking place in PSII are too fast at room temperature that makes their study impossible. As a result, the EPR measurements are performed at low (cryogenic) temperatures in order to slow down the charge transfers. Even at such low temperatures, some paramagnetic centers, such as Υz•, remain short lived and we are forced to employ more advanced experimental techniques involving rapid scans.
The objectives of the activity are the deeper understanding of the proton transfer and electron transfer reactions that take place during the catalytic steps, and the characterization of the magnetic interactions between the species involved in the water oxidation mechanism. In particular we study:
(a) the trapping and characterization of the various configurations that the OEC undergoes during the S-steps, since aspects of the mechanistic details for the electron and proton transfers and mostly for the final oxygen evolution step remain entirely speculative.
(b) the highest stable oxidation state (i.e. the S3 state), which is necessary given the number of open questions related to its structure and its water ligation mode.
(c) the magnetic interactions between the Mn4CaO5 cluster and the Yz• at the various intermediate states, given that the current understanding is relatively poor and described by very approximate theoretical models.
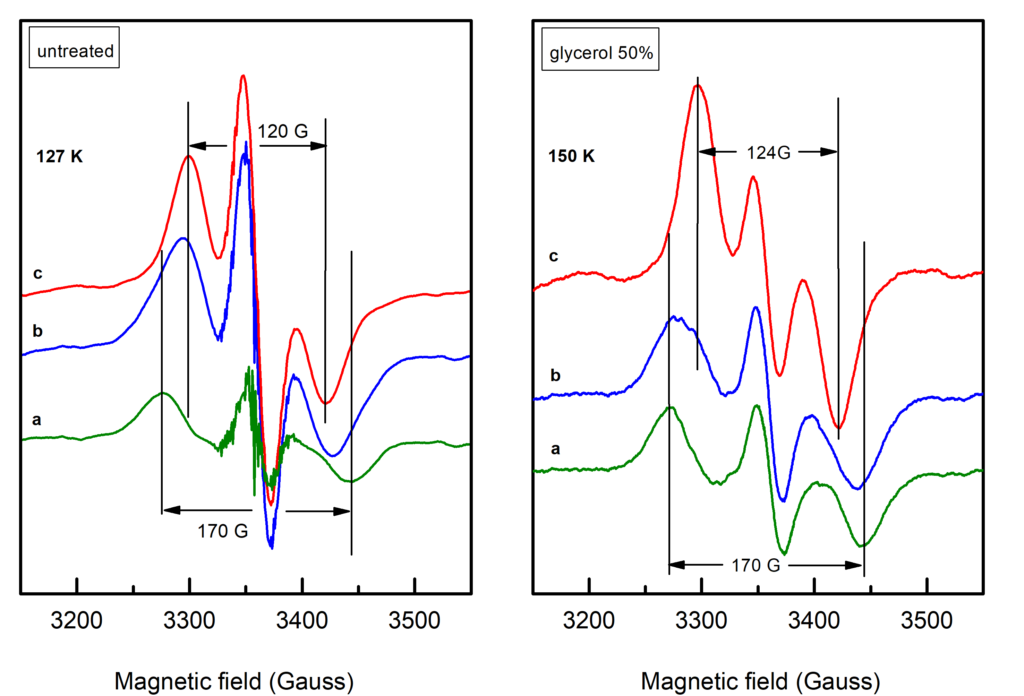
Objective (a) is exemplified by our EPR studies on short-lived reaction intermediates trapped during the S-state cycle of Photosystem II (ref. 1).There are two major steps on each S-state transition; the oxidation of an appropriately positioned tyrosine, YZ, by P680+ and the subsequent oxidation of the central catalytic core, the Mn4CaO5 cluster, by oxidized YZ. Proton translocation is a dominant factor, being the rate limiting step for the partial reactions leading to oxygen evolution. In the first place, the redox function of YZ is coupled to proton exchange with a nearby base, presumably H190, while in the second, one electron and on the average one proton are extracted from the Mn cluster on each S-state transition (see figure 2). No net proton release is observed in the S1 to S2 transition and the Mn environment is considered to be more electro-positive in S2 and S3. We have made extended studies on the S2YZ• intermediate which is trapped by illumination in the temperature range 77 K to 190 K of samples poised in the S2...QA state. X-band EPR experiments at 10 K indicate that the intermediate consists of two components. A wide one with a splitting of ca. 170 G, and a narrow one characterized by a splitting of ca. 120 G (untreated), or 124 G (glycerol treated samples) (figure 3).
Lower temperatures of illumination in the above temperature range favour the wide component, which at 10 K decays faster than the narrow one. Re-illumination at 10 K after decay of the signal trapped at 77 – 190 K induces only the narrow component. Rapid scan experiments in the temperature range 77 – 190 K reveal high resolution spectra of the isolated YZ• radical and no evidence of alternative radicals. The two split signals are accordingly assigned to different conformations of the S2YZ• intermediate. A point-dipole simulation of the spectra yields "effective distances" between the spin densities of YZ• and the Mn4Ca center of 5.7 Å for the wide and 6.4 Å for the narrow component (figure 4).
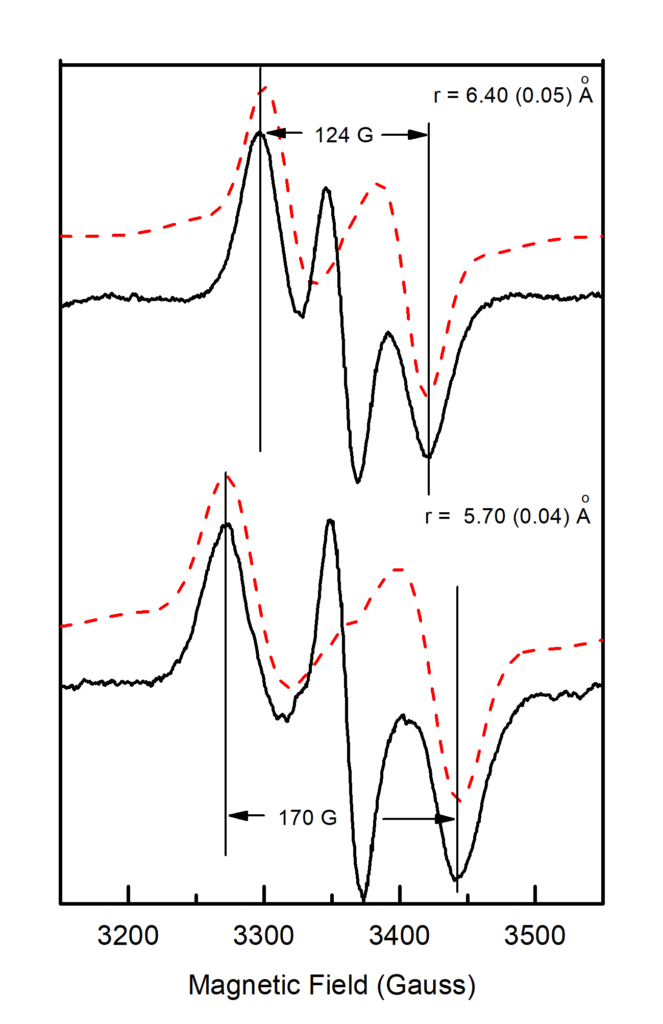
The results are interpreted with respect to a molecular model assuming two sequential proton transfers during oxidation of YZ. The wide component is assigned to a transient S2YZ• conformation, which forms during the primary proton transfer (figure 5).
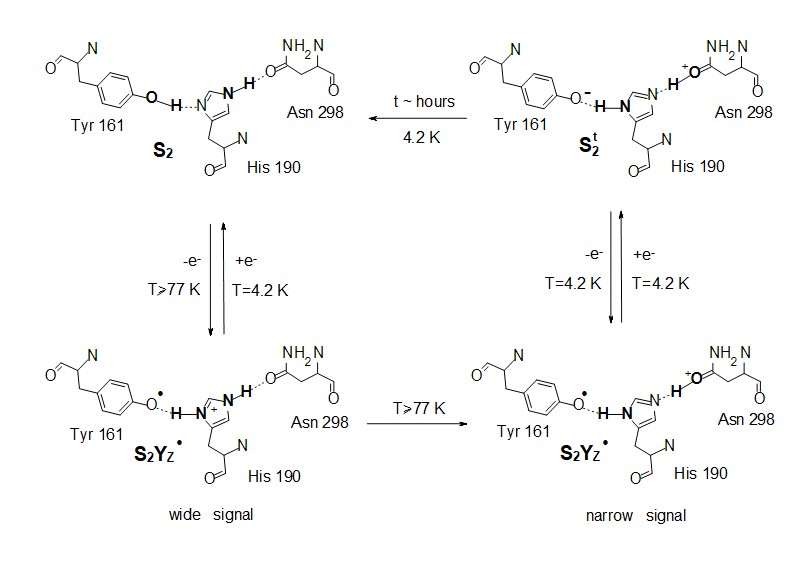
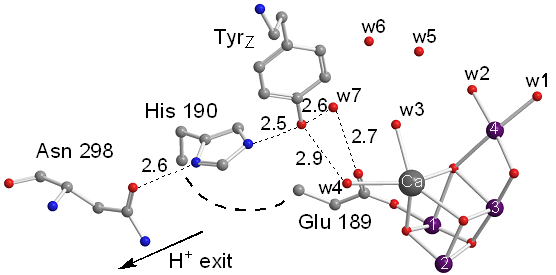
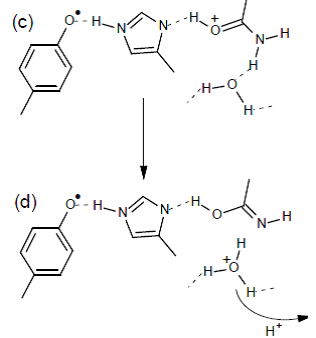
Our observations strongly indicate that the modification of the proton arrangement of the Mn4O5Ca during the S2 to S2t step results in proton redistribution in the vicinity of YZ, presumably along the YZ-His190-Asn298 pathway. This effect facilitates the oxidation of YZ in the S2t constrained configuration, reflecting the difference between the latter configuration and the S2. The possibility of proton transfer with involvement of Asn298 upon oxidation of YZ is suggested by DFT calculations, performed by the group of Dimitrios Pantazis (Max-Planck-Institut für Kohlenforschung, Kaiser-Wilhelm-Platz 1, 45470 Mülheim, an der Ruhr, Germany). It is suggested that proton transfer can occur from His190 via Asn298 to a vicinal asparagine-rich water cavity which acts as proton reservoir. This proton movement is enabled by tautomerization of Asn298 from the amide to the imidic acid form (figure 6), and can be an intermediate step in further translocation and release of the proton to the bulk (ref. 2).
Ref. 1: J. Photochem. Photobiol. B, 2011; 104: 72-79, doi: 10.1016/j.jphotobiol.2011.02.012
Ref. 2: J. Phys. Chem. B, 2019; 123(14): 3068-3078, doi: 10.1021/acs.jpcb.9b02317
Objective (b) is exemplified by our recently published elucidation of the spin heterogeneity of the S3 state of Photosystem II (ref.). As noted above the inorganic Mn4CaO5 cluster cycles through four light-driven oxidation steps denoted as S0→S1, S1→S2, S2→S3, and S3→[S4]→S0. O2 evolution occurs during the last transition, S3→[S4]→S0, where the S4 is a metastable state. Among the aforementioned oxidation states of the Mn4CaO5, the final S3 state is critically important because precedes O2 evolution. Our past EPR investigation at X-band and Q-band of the S3 state showed that its ground spin state is S=3. During 2019 we carried out detailed EPR investigation of the S3 state at both X-band and Q-band, in native and methanol-treated PSII of Spinacia oleracea (spinach). Figure 3 shows the S3 EPR spectra from intact PSII and from MeOH-containing PSII spinach preparations obtained at X- and Q-band together with their simulation curves. In untreated samples the X-band spectra at both perpendicular and parallel modes can be successfully described by the spin Hamiltonian parameters S=3, g=2, |D|=0.179cm−1, and E/D=0.28. Regarding the S3 Q-band EPR spectrum of intact PSII, the theoretical curve obtained by assuming the aforementioned parameters fits the experimental EPR signals mostly at the high field region. However, several features at lower magnetic fields do not match the corresponding areas of the theoretical curve, indicating the presence of an additional spin configuration that is “EPR silent” at X-band. Indeed, our detailed simulated analysis of the Q-band EPR spectrum showed that the combination of the S=3, g=2, |D|=0.179cm−1, and E/D=0.28 parameters and the S=6, g=2, D=+1.51 cm−1, E/D=0.138 ones satisfactorily reproduces the complete S3 experimental spectrum at Q-band. In addition, a unique spin configuration of S=6 with parameters of g=1.98, D=+1.523 cm−1, E/D=0.14 successfully describes the S3 EPR spectrum in MeOH-containing spinach PSII preparations.
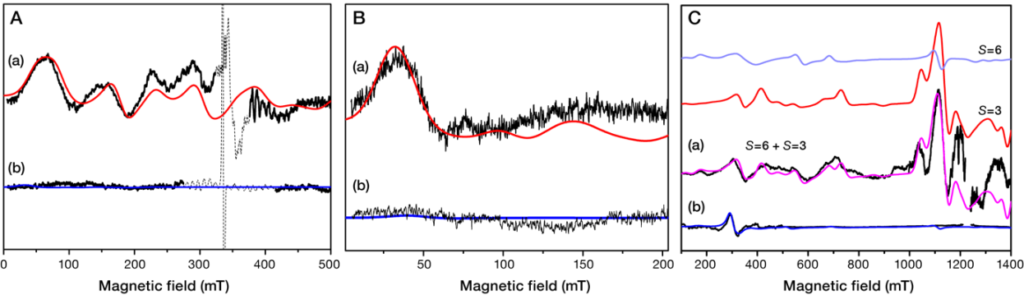
Hence, the S3 state appears heterogeneous (S=3 and S=6) in the untreated PSII and homogeneous (S=6) in the MeOH containing PSII. These experimental observations will be combined with theoretical studies, involving DFT analysis, in collaboration with Dr. Dimitrios Pantazis, at Max-Planck-Institut für Kohlenforschung, Mülheim an der Ruhr, Germany.
Ref.: Angewandte Chemie - International Edition, 2021; 60(6): 3156-3162, doi:10.1002/anie.202012304
High-energy resolution fluorescence detected (HERFD) X-ray absorption spectra of all S states of the Oxygen Evolving Complex
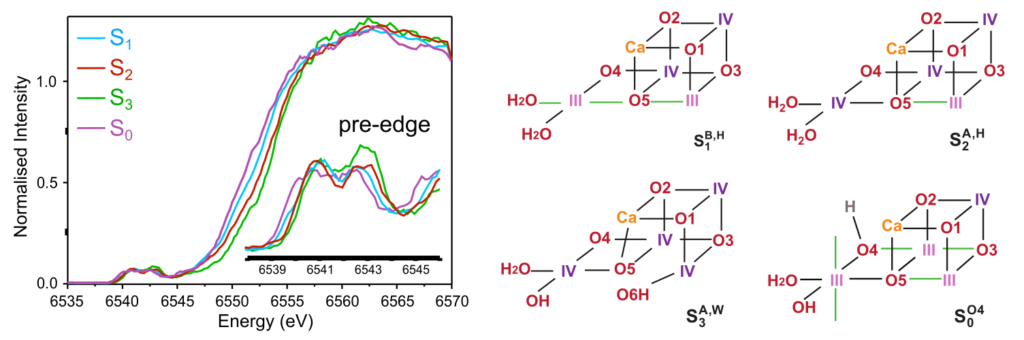
X-ray absorption spectroscopy (XAS) can selectively probe the electronic and geometric structure of the element under study, in the present case Mn. In particular, the pre-edge region of the Mn K-edge spectrum corresponds to weak 1s→3d transitions, whose intensity depends strongly on the local environment of the Mn ions. The combination of experimental spectroscopy with quantum chemistry calculations enables direct correlation between spectral features and structural models of the OEC.
Using Mn Kα high-energy resolution fluorescence detected (HERFD) XAS, highly resolved spectra of the S0–S3 states were obtained, providing a detailed picture of the pre-edge region throughout the Kok cycle. In contrast to previous studies, glycerol-free PSII samples were used in order to avoid heterogeneity effects in the S3 state. In parallel, time-dependent density functional theory (TDDFT) calculations were used to simulate XAS spectra for a broad range of OEC structural models and to establish a direct mapping between spectroscopic and structural properties. The comparison between experiment and theory demonstrated that the HERFD spectra of the S3 state are consistent only with all-Mn(IV) oxo-hydroxo models. These findings exclude ligand-based oxidation during the S2→S3 transition and indicate that the onset of O=O bond formation occurs after the final light-driven oxidation step of the catalytic cycle.
Ref. J. Am. Chem. Soc. 2023, 145, 47, 25579–25594 https://doi.org/10.1021/jacs.3c06046
High-energy resolution fluorescence detected (HERFD) spectra of the ammonia S2
The insertion pathways and binding sites of substrate water molecules at the OEC remain an open question. To probe substrate access and binding, small molecules have been widely employed as water analogues, with ammonia being one of the most extensively studied. HERFD X-ray absorption spectroscopy of ammonia-treated S2 state was used, in combination with quantum chemical calculations, to discriminate between proposed ammonia binding configurations at the OEC.
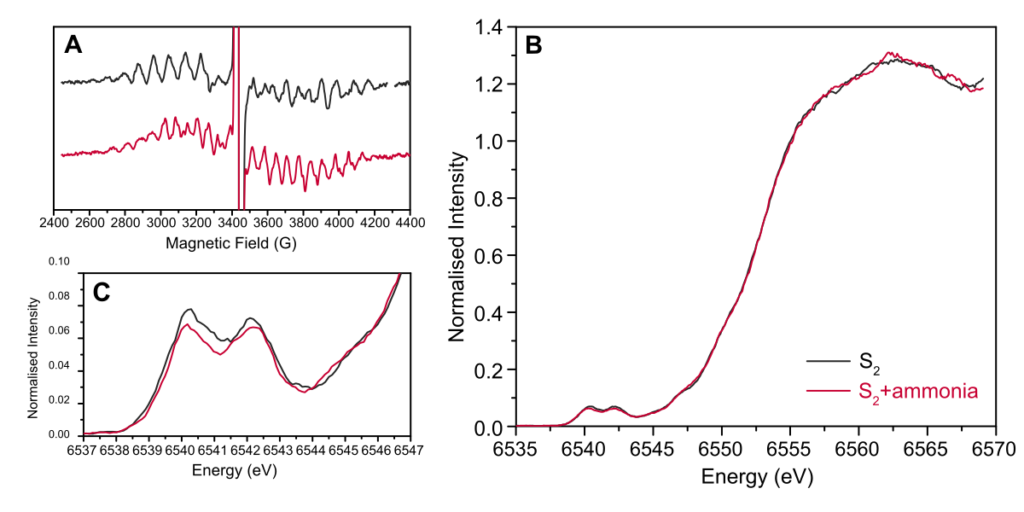
Experimental difference spectra between native and ammonia-treated samples were compared with calculated spectra for models representing all proposed binding modes. Clear deviations from experiment were obtained for models involving substitution of the bridging μ-oxo ligand O5, especially in its nitrido-form, as well as for models in which ammonia acts as an additional sixth ligand to Mn4. In contrast, the best agreement with experiment was found for models in which ammonia replaces the terminal water ligand W2 on Mn4, followed closely by substitution of the second terminal ligand W1, while a sixth-ligand coordination on Mn1 also yielded comparatively low deviations.
Quantum chemical analysis indicates that the observed spectral differences arise primarily from variations in Mn octahedral distortions, which modulate 4p–3d orbital mixing and thereby influence the Mn K-edge pre-edge features. These results highlight the high structural sensitivity of Mn K-edge HERFD XAS and demonstrate its capability to resolve subtle geometric variations within a given redox state of the OEC. Overall, the combined spectroscopic and computational analysis provides strong support for ammonia binding via substitution of a terminal water ligand on Mn4, consistent with the view that this site represents the most accessible and/or strongly interacting position for substrate analogues within the OEC.
Ref: J. Phys. Chem. B 2025, 129, 15, 3776–3787 https://doi.org/10.1021/acs.jpcb.5c00269