Applications
Application of magnetism in mineral processing
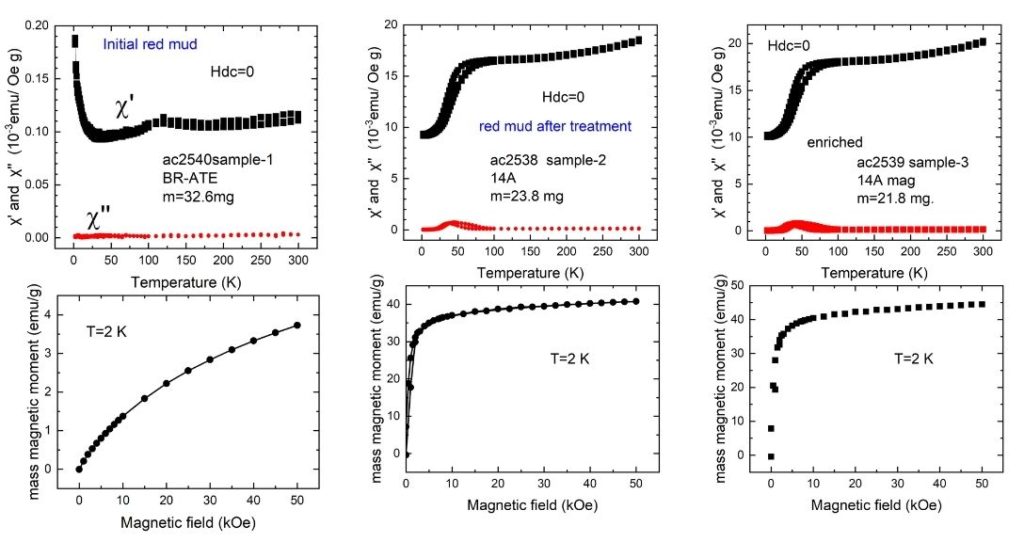
Magnetism can be a useful tool in the mineral processing industry when the target mineral has a magnetic moment. Moreover, magnetic measurements are important for the qualitative and quantitative control of mineral and metallurgical processes. We used magnetic measurements to characterize bauxite residue and its reduced form, which has high iron content.
https://doi.org/10.1016/j.mineng.2024.108954
Magnetically controllable sponges for crude oil, mercury, and arsenic removal
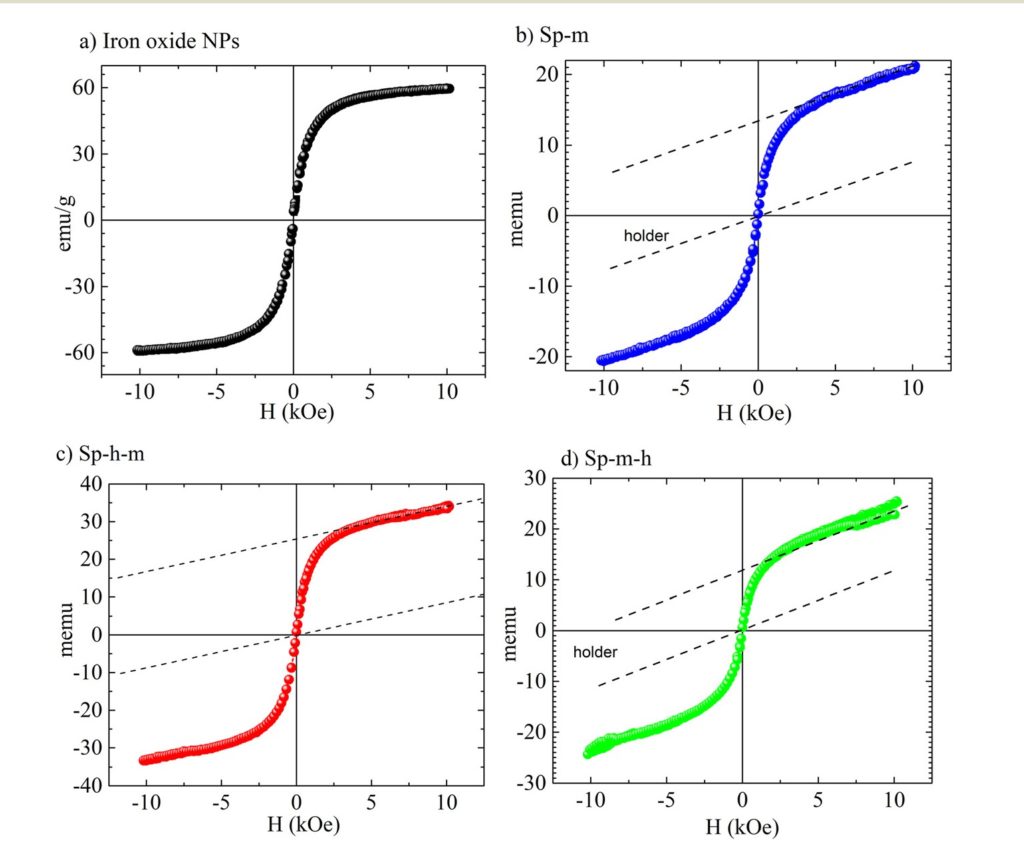
Room temperature magnetic hysteresis loops for all four samples. The hysteresis curve of (a) the non-stoichiometric magnetite NPs recorded in powder form, with the Y axis presented in emu g−1. For recording the hysteresis curves of the Sp-m, Sp-h-m and Sp-m-h samples, small pieces of the modified sponges were measured. Their magnetization is provided in memu, and the contribution of the sample holders' curve is also presented for clarity (dashed lines). The modified sponges were weighed: (b) 1.5 mg Sp-m, (c) 2.2 mg Sp-h-m, and (d) 2.5 mg Sp-m-h.
https://doi.org/10.1039/d5en00549c
Crack detection using magnetooptic sensors
The detection of the stray magnetic field generated by cracks in a magnetized ferromagnetic specimen is the basic physical principle underlying several non-destructive methods. The most popular method of this category is the detection of cracks using magnetic particles. In addition, GMR and Hall sensors are also used. The aim of this work is to study and develop a methodology for the nondestructive evaluation of cracks on rail surfaces caused by rolling contact fatigue (RCF). The magnetooptical phenomenon can be described phenomenologically by an electrical permittivity tensor which depends on the external magnetic field.
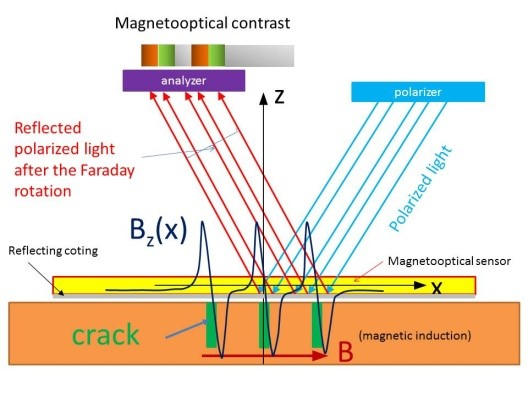
Fig. 1 Schematic illustration of the mechanism that produces magnetooptical contrast on the surface of a magnetic specimen with cracks. The black curve represents the change in the vertical component of the magnetic induction 0.5-1 mm above the cracks. In the crack area, the magnetooptical sensor is magnetized in an “up-down” orientation, causing the polarization plane of the reflected light to rotate in the opposite direction.
The magnetization of a material causes a secondary motion of the electrons u=-M x E (u the electron velocity, M is the magnetization of the material, and E the electric field of the incident electromagnetic wave), which in turn generates electromagnetic waves with a rotated polarization plane. The material relation between the electric displacement and the electric field will have the form D = ε (E + iQvM × E), where Qv is the Voigt constant. In a magnetooptical sensor, rotation of the polarization plane of the reflected (Kerr effect) or transmitted (Faraday effect) light can occur, depending on the sensor's magnetization. The two phenomena are described by the general term magnetic circular dichroism (circular magnetic birefringence). Fig. 1 shows schematically how the magnetooptical contrast is generated above a magnetized specimen with cracks. Linear polarized light, when passing through a transparent magnetooptical specimen, is subject to rotation of the polarization plane, which depends on the direction of the magnetization. The cracks on the surface of a magnetized specimen produce a stray magnetic field with a different direction on the right and left sides of the crack. This effect results in the opposite magnetization of the sensor near the crack. This alternative magnetization induces a different rotation of the incident light, producing the magnetooptical contrast when it passes through the analyzer. The magnetooptical contrast is directly related to the geometrical characteristics of the cracks. In our study, we used a thin film of the mixed garnet Y3-xBixFe5O12 as a magnetooptical sensor. This compound is a ferrimagnetic material (ferromagnetic garnet) which, in a non-magnetized state, displays stripe-type magnetic domains, with a characteristic size of a few micrometers (see fig. 2).
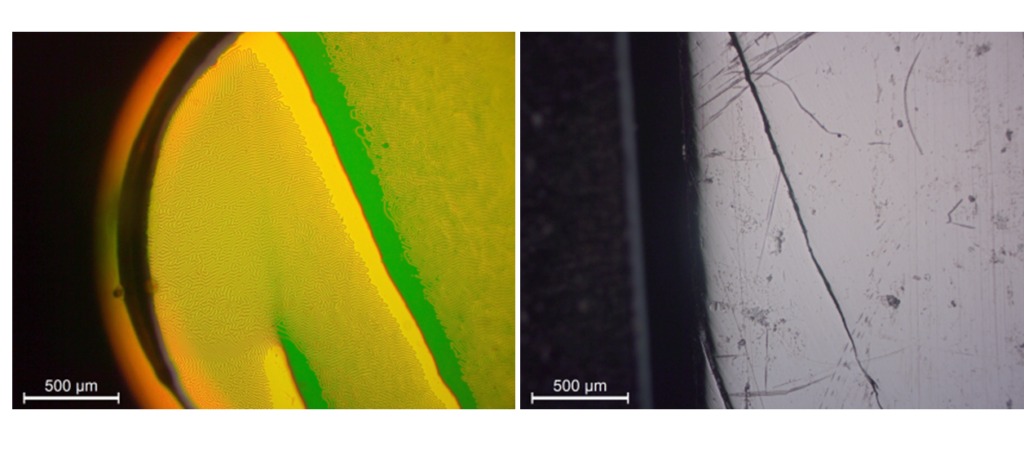
Fig. 2 Magnetooptical contrast produced in an optically polished transverse cross-section of the head of a rail track. The left photograph shows the magnetooptical contrast produced after linearly polarized light is transmitted through the garnet film, reflected at its reflecting coating, and back-transmitted. The magnetooptical sensor is located on the surface of the specimen. The microscope analyzer was set at 90° to the polarization plane of the incident light. The right picture shows a conventional optical contrast of the transverse cross-section of the rail head. One can see two nearly parallel cracks at a 30° angle to the rail head surface.
Figure 2 illustrates the generated magneto-optical contrast when a magnetooptical sensor is placed above a magnetized material surface with two breaks.
Magnetic field mapping in plastically deformed soft magnetic materials
Soft magnetic materials are important components of electrical-to-mechanical energy conversion devices. Classic examples are electric motors and generators. The rapid increase in the use of electric cars, however, and the huge prospects in this area, make the study of magnetic losses in magnetic steels an important issue. Magnetic steels of electric motors are mainly Fe-Si alloys with or without orientation of their crystallites (texture). The most important cause of energy loss in these magnetic materials is the magnetic field lag due to the presence of crystalline boundaries and residual mechanical stresses/strains. In this research project, an attempt is made to relate the magnetic field on the surface of magnetic steel (produced by rolling) to the residual mechanical stresses/strains.
In the experiments we perform, we record the horizontal (parallel to the sheet) and the vertical component of the magnetic field on the outer surface of the specimens. The sheets are produced by cold rolling. The horizontal component of the magnetic field was measured with a GMR sensor, and the vertical component with a Hall sensor. The measurements were made by moving the sensor above the test piece using the xy-stage (see Fig 3).
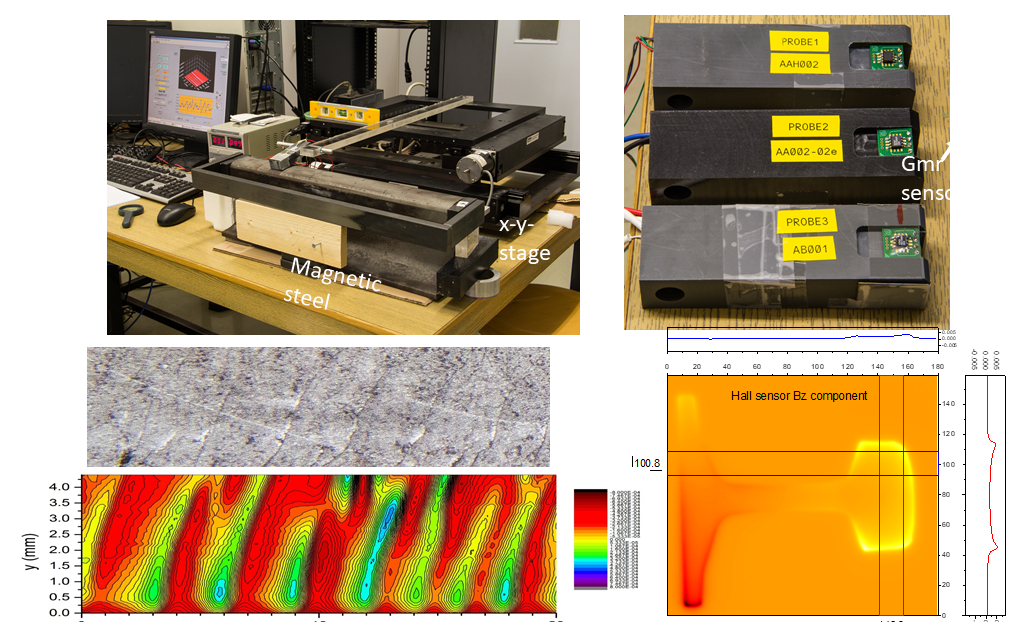
Fig. 3 Experimental setup used to map the magnetic field above ferromagnetic objects
Representative results of our measurements are shown in Figure 4
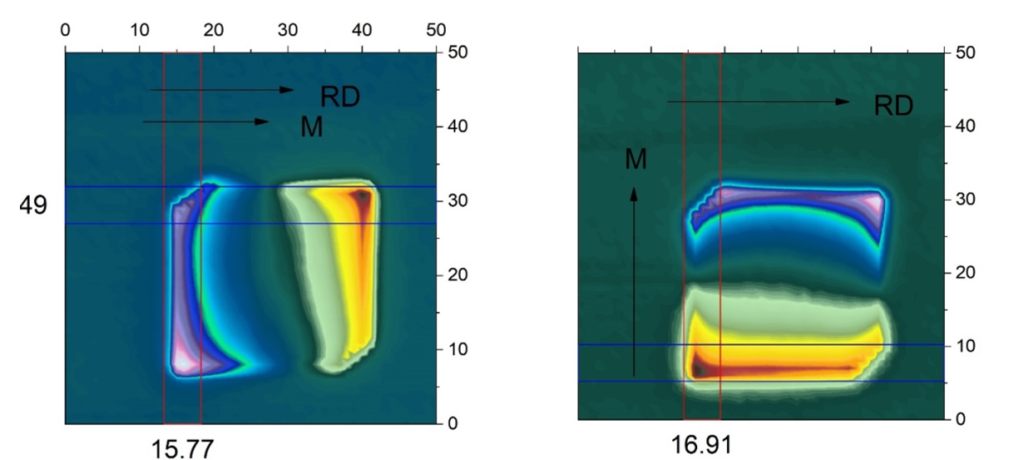
Fig. 4 Spatial variation of the vertical component (perpendicular to the sheet surface) of the magnetic field. The sheet underwent rolling deformation (reduction in thickness from 0.5 mm to 0.3 mm, sheet 17). The measurements have been made using a Toshiba Hall sensor (Vo = 5 V). The two arrows indicate the direction of the rolling (RD) and the magnetizatioν respectively.