Superconductivity
Vortex matter properties in type-II superconductors are an interesting and rich topic in physics. The study of vortex matter properties is not merely an academic exercise but also relates to practical applications of superconductors and may help to understand the properties of conventional matter. For several years, we have studied vortex properties across all known families of type-II superconductors.
Critical electric current estimation from magnetic susceptibility measurements of
Ba1-xKxFe2As2 superconductor
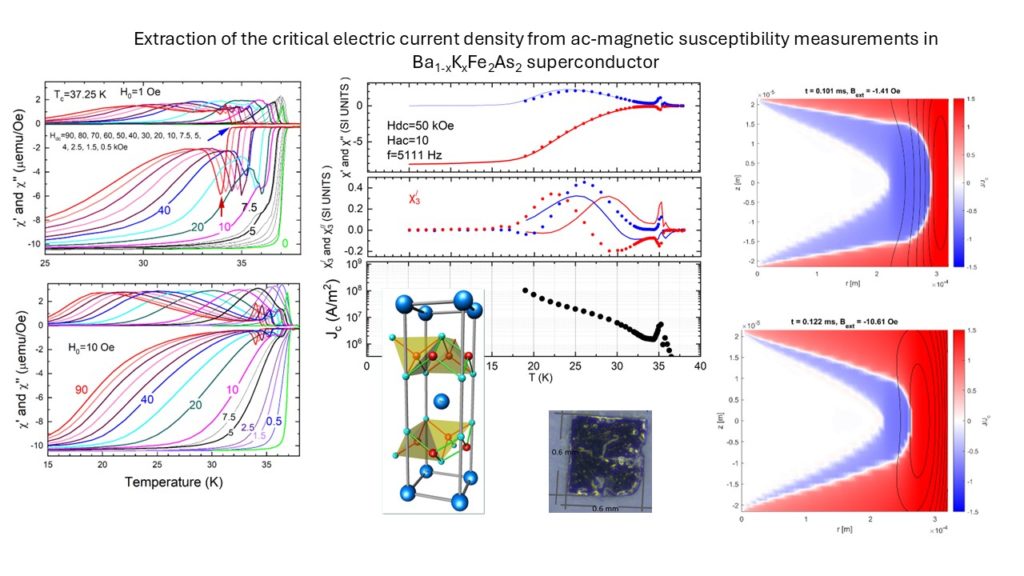
The critical current density, Jc, that a type II superconductor can support is an important parameter from both fundamental and practical points of view. For example, applications such as the production of high magnetic fields require superconductors capable of carrying high electric currents without energy dissipation. On the other hand, the critical current as a function of temperature and external magnetic field is a parameter directly related to vortex matter properties of the Abrikosov state of a type II superconductor. The Jc can be measured directly using the four-wire method if a large sample is available.
In this project, we develop a novel method in which Jc is estimated by fitting magnetic ac susceptibility measurements, χ(f, T, H), collected as a function of frequency, temperature, and external magnetic field. A type-II superconductor can be phenomenologically considered as a non-linear conductor with a non-linear current electric field relation E=Ec(J/Jc)n. By using the Maxwell equations in the quasi-static approximation, one can find that the current density flowing in the superconductor obeys a nonlinear, non-local diffusion equation. Numerically solving this equation as a function of time yields the time evolution of the magnetic moment, and, with a Fourier transform, the components of the magnetic ac-susceptibility. For a given external magnetic field, the optimum Jc value is estimated from this, which gives a minimum of the (Re[χe]-Re[χc(Jc)])2, where χe and χc are the experimental and theoretical parts of the fundamental part of χ.
A representative example of our effort is shown in the figure.
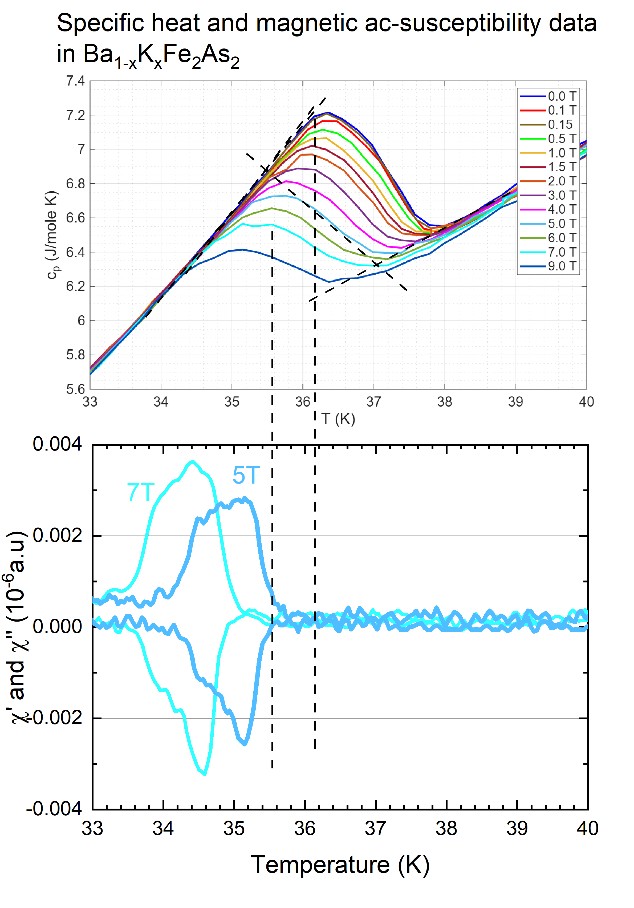
Abrikosov/normal state phase boundary and its relationship with the peak effect line and onset of the magnetic ac-susceptibility.
A second interesting project, which we are addressing about the vortex matter properties of the Ba1-xKxFe2As2 superconductor, concerns the relationship between the onset of the third-harmonic ac-susceptibility and the phase transition observed in specific heat measurements under an external dc magnetic field. The following figure displays the specific heat measurements recorded under a DC magnetic field. This figure clearly shows the “signature” of the phase transition from the superconducting to the normal state in Ba1-xKxFe2As2. One can observe the displacement of the specific heat “step” toward lower temperatures as the externally applied magnetic field increases. The phase boundary separates the Abrikosov state from the normal state, and the normal state can be estimated using an entropy-conservation methodology. We have also plotted the temperature dependence of the ac susceptibility measured in a dc magnetic field.
Frequency dependence of the magnetic ac susceptibility in the peak effect region of Ba1-xkxFe2As2 superconductor (superconducting materials)
The vortex matter (Abrikosov state) in type II superconductors under the influence of weak pinning centers is an interesting physical system with many similarities to conventional matter. Despite the intensive research effort devoted to studying vortex matter, the discovery of new superconductors still holds many surprises and novel, not well-understood physical effects. One of the most intriguing effects observed in all type II superconductors with weak pinning centers, interesting both from a basic physics and applications point of view, is the non-monotonous variation of the critical current. In the related literature, this phenomenon is called the peak effect (mainly in low-Tc superconductors), the second magnetization peak (in high Tc superconductors), or sometimes the fishtail effect. Experimentally, the peak effect appears as a diamagnetic negative peak both in dc and ac-susceptibility measurements as a function of temperature, or as non-monotonous variations of the dc-magnetization as a function of dc-magnetic field.
The onset of the peak effect (the local minimum of the screening current) corresponds to the Bragg-glass-to-vortex-glass transition. Mikitik and Brandt, using Lindemann-type criteria and results from collective pinning theory, estimated the vortex matter phase diagram, accounting for both thermal fluctuations and random point disorder. Usually, the weak frequency dependence of the ac-susceptibility in type II superconductors is attributed to flux creep of vortices, a slow process, in contrast to the strong frequency dependence predicted for a linear conductor. For Ohmic behavior E=ρJ, the ac-susceptibility is linear and frequency dependent (e.g., max χ''~1/Öω). On the other hand, for a "Bean" superconductor (Ε= E0(J/Jc)n, n>>1) the ac-susceptibility is non-linear and frequency independent. As shown below, we observe a weak frequency dependence of the ac susceptibility, implying that the departure from the critical-state model is small. According to Faraday's law, a frequency change of the external magnetic induction is equivalent to a change in the electric field level developed in the superconductor.
Following Brandt's scaling arguments, when the superconductor can be described by a power-law current-voltage EJn, a change of frequency by a factor k, and the amplitude of the ac-field by a factor k1/n-1, then the susceptibility does not change, e.g., χ(f/B01/n-1}). Based on this, one expects that an increase in frequency, with the amplitude of the ac field held constant, also increases susceptibility.
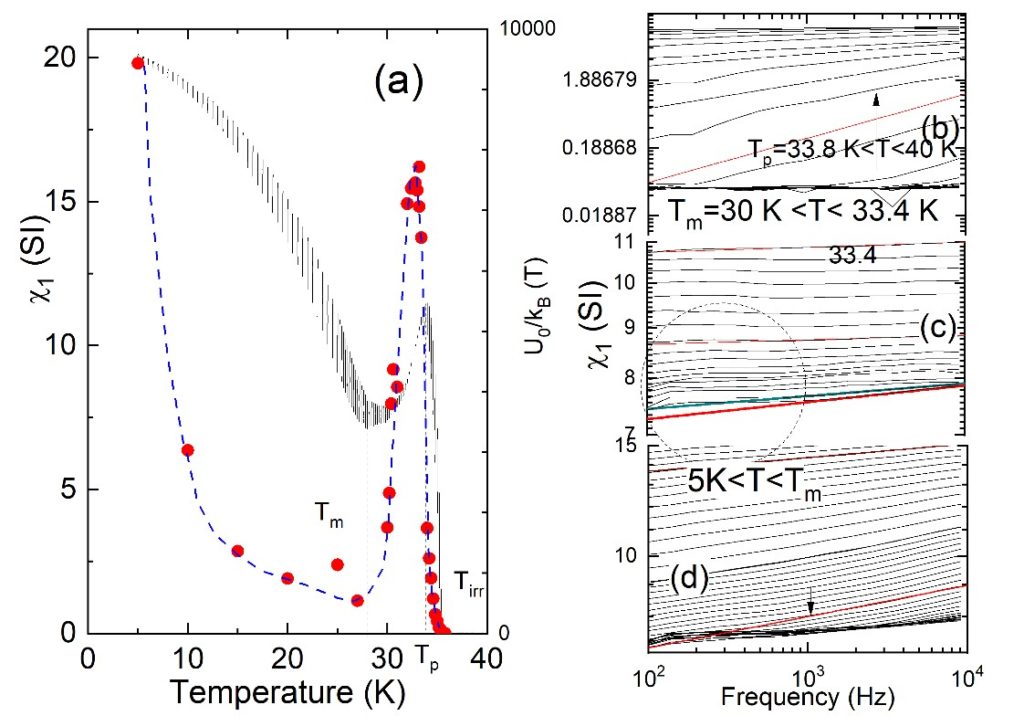
Fig. 3 shows the temperature dependence of the fundamental ac-susceptibility χ1, measured under a dc magnetic field μ0Hdc = 7 Tesla and an ac amplitude H0 = 15 Oe at several frequencies.
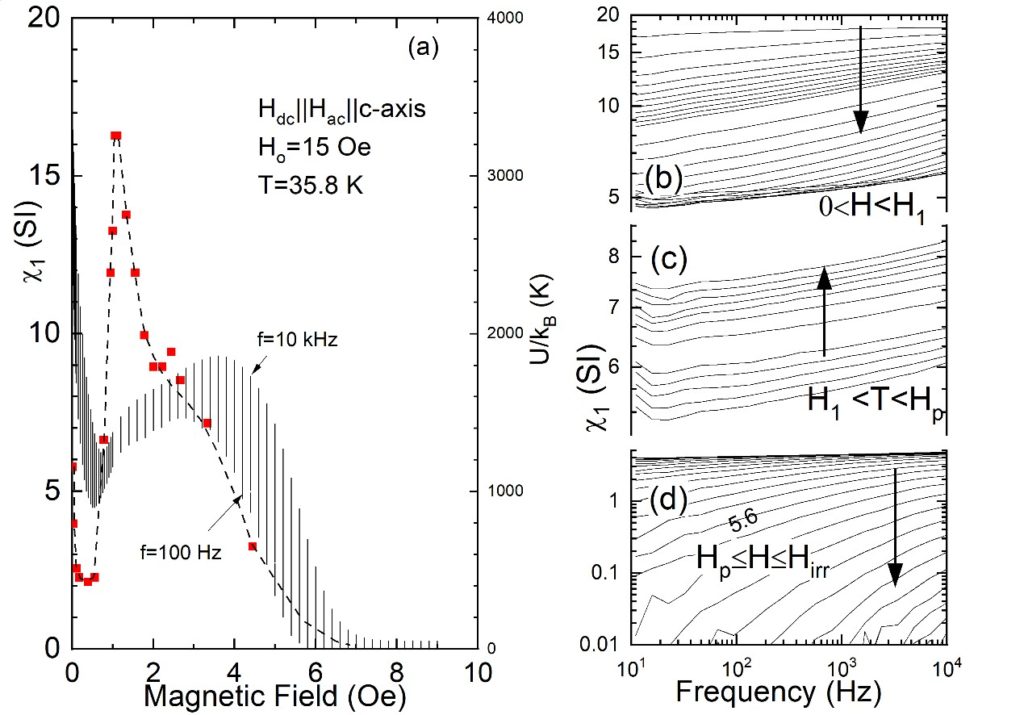
The panels (b), (c) and (d) of Fig.3 show the frequency dependence of χ'1 for constant temperature in double logarithmic plots, in the temperature intervals Tp<T<Tc (panel (b)), Tm<T<Tp (panel (c)) and 5 K< T<Tp (panel (d)), respectively (see Fig.3 for the meaning of Tp, Tm and Tirr). In the temperature interval Tp<T<Tirr, χ'1(f) increases roughly as χ1~fα and shifts nearly parallel as temperature approaches Tp. Below Tp, the frequency dependence is very weak , nd slightly above Tm, the slope of lnχ’1(f) versus log(f) becomes negative in the low-frequency range (see the region inside the dashed circle in Fig. 3). This is an interesting result not predicted by collective creep theory. Finally, for T<Tm, χ’1(f)-curves display a positive slope again in a double logarithmic plot (Fig.3(d)). The absolute logarithmic slope dlogχ’1(f)/dlog(f) gradually increases with temperature, passes through a maximum at around T~ 25 K, and then tends to zero as TÞ 5 K. Based on the foregoing results w, we can conclude that ac-respond reveals three dynamic regimes. Fig.4 shows the frequency dependence of the ac-susceptibility for H_0=15 Oe, by varying the dc-magnetic field for constant temperature T=35.8 K. After the Meissner state, where logarithmic rate is zero, it forms a maximum, and as HÞH1 (see Fig. 4(a)) is approached, the slope tends to zero. For H>H1, dlog χ'1(f)/dlog(f) gradually increases. For H>Hp(f=11 Hz), the logarithmic slope increases and passes from a maximum and finally becomes zero at Hirr. The data in the particular field regime reveal that the location of the peak effect depends on frequency, e.g. i,,t moves from 2.5 Tesla for f=11 Hz to 3.6 Tesla for f=10 kHz. Since χ' has a monotonous dependence on the critical current, |χ’| should have the same frequency dependence on the critical current. Having found that the frequency dependence is roughly a power law (χ1 = f^α), we analyzed the data assuming that the exponent is related to an energy barrier by α = k_B T/U_0, where k_B is the Boltzmann constant. In Fig.3 and Fig.4, a plot of U0 as a function of temperature (external magnetic field in Fig. 4) is added (right scale in panels (a)). We keep in mind that although U0 is a phenomenological parameter, its temperature dependence reveals the dynamics at play that create the peak effect. It is interesting to note that the peaks of U0(T) and U0(H) curves both occur below the peak temperature (peak field), (https://doi.org/10.1088/1361-6668/ac6774 and unpublished results).
Slush vortex matter phase in YBa2Cu3O7 superconductor at tilted magnetic field
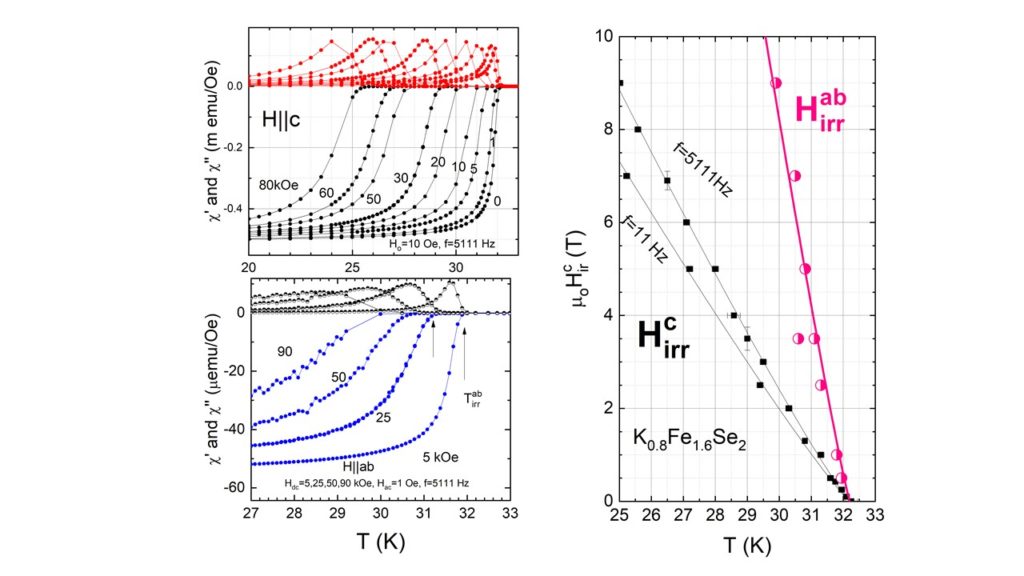
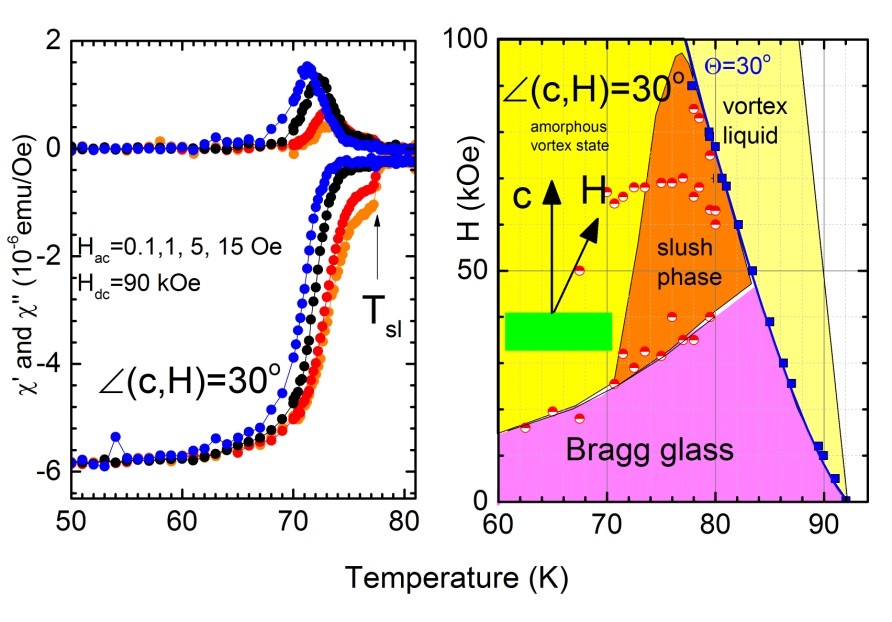
The vortex matter in high-temperature superconductors exhibits novel phases, primarily due to the growing role of thermal fluctuations. The aim of our research effort is to explore unresolved issues in vortex matter using high-quality single crystals. One of the issues not yet well understood is the slush vortex matter phase. It has been proposed that this phase exists above the intersection of the Bragg glass line and the peak-effect onset line. Figure 1 (left panel) shows the temperature dependence of the ac susceptibility, measured in a dc magnetic field H = 90 kOe, tilted 30° with respect to the crystal c-axis. Our experimental data offer significant evidence that the sharp drop of the χ’ (indicated with an arrow in Fig. 1) corresponds to the transmission from the liquid to the slush vortex state.
Vortex matter of properties of the K0.8Fe2-ySe2 superconductor
Superconductivity in intercalated iron selenides is an interesting topic because the physical mechanism underlying the superconducting state may be related to quantum-matter phenomena, topological superconductivity, and Majorana zero modes.
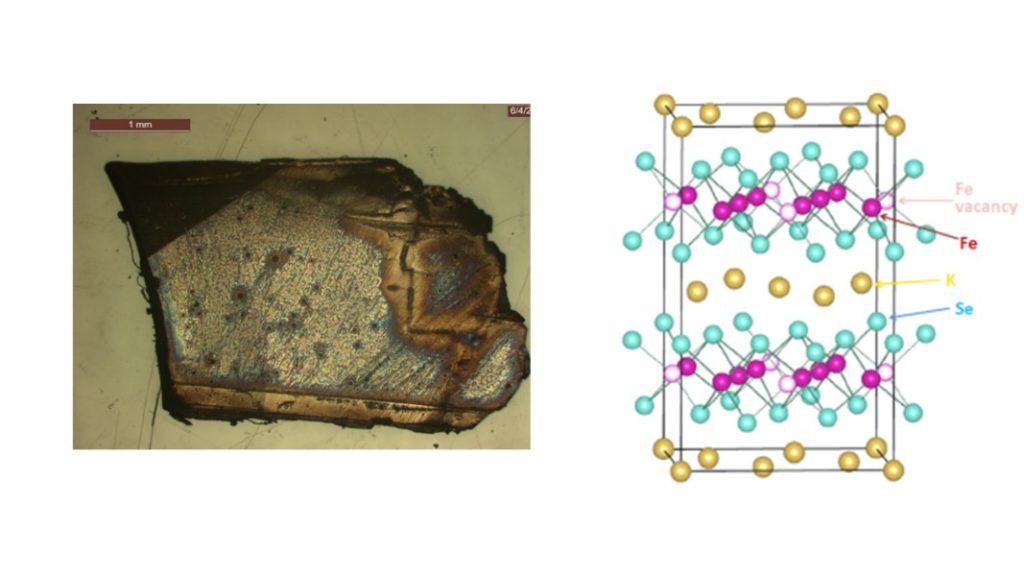
Figure 2 (left panel) shows preliminary results on the vortex matter properties deduced from ac-susceptibility measurements in a K0.8Fe2-ySe2 single crystal for dc magnetic fields (0-9 Tesla), applied parallel to the c-axis and ab-plane. The experimental data were collected at frequencies ranging from 10 Hz to 10 kHz. From the diamagnetic onset, the irreversibility lines, both for H||c-axis and H||ab-plane, were estimated as a function of temperature and frequency.